News & Media
Market Perspectives – Third Quarter, 2023

CitizensTrust – A Division of Citizens Business Bank
Click on images below to enlarge.
Equity markets pulled back in the third quarter of 2023 after a strong start to the first half of the year. Bond prices continued to fall because of rising interest rates that were driven by stronger-than-expected economic data.
Equity Markets
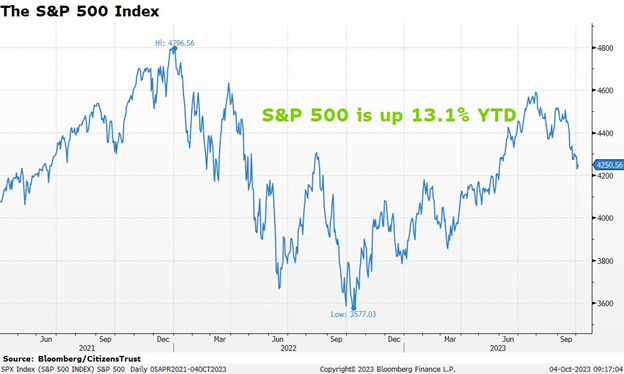
The S&P 500 Index fell 3.3% in the third quarter and remains up 13.1% year-to-date. Underlying market performance has been dominated by large-cap companies while more interest rate sensitive small and mid-cap companies have lagged the index.
Technology and communication services remain the best-performing sectors YTD. There has been a lot of investor attention focused on the mega-cap names in the S&P 500 that have driven the S&P’s performance this year. The seven largest companies in the S&P 500 are Apple, Microsoft, Amazon, Nvidia, Alphabet, Tesla, and Meta. They amount to 28% of the index and each of those companies has outperformed the market this year by a wide margin. The worst-performing stock in that group is Apple and it is up 33% YTD. The best performer has been Nvidia, up 200%, with Tesla and Meta also up over 100% YTD. Wall Street has begun affectionately referring to this group as the “magnificent seven”
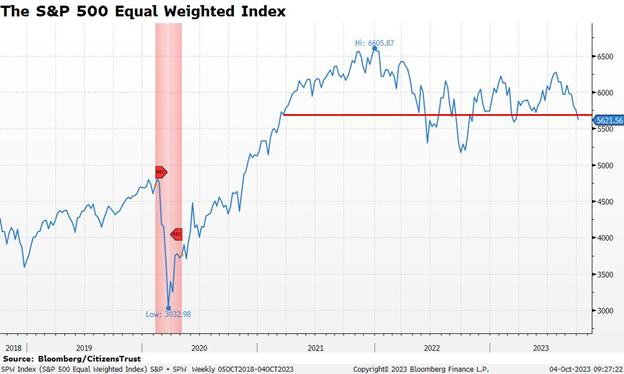
In fact, if those seven positions were excluded from the index, the rest of the S&P 500 is down for the year. Another way to measure broad market performance is to look at an equal weighted version of the S&P 500 (SPW). That index is also down slightly for the year and is back to levels first reached in the first quarter of 2021. The S&P 500 Index remains top-heavy and its largest components are masking a broader market that hasn’t done much this year.
For the third quarter, mid-cap stocks, as measured by the Russell Mid-Cap ETF, fell 4.7% and small-cap stocks, as measured by the Russell 2000 Small-Cap ETF, fell 5.2%. On a YTD basis, mid-cap has gained 3.8% and small-cap is up 2.5%, under-performing the S&P 500 by a large margin.
The U.S. market outpaced international indices by a slight margin, owing in part to a strong U.S. dollar. International Developed markets, as measured by the EFA ETF, fell 5.0% during the quarter and have gained 6.9% this year. Emerging markets, as measured by the EEM ETF, were down 4.1% for the quarter and are barely up 1.0% this year. Globally, the MSCI World Index gave up 3.7% in the third quarter, yet remains up 9.9% YTD.
Interest Rates
The fixed income market struggled in the third quarter of 2023 as interest rates rose. The Fed increased the fed funds rate by 25 basis points in July to 5.5% and continued to signal that more rate increases may be necessary to fight inflation. The Fed has been consistent and relatively unanimous in its messaging that interest rates will likely have to remain “higher for longer” than the market expects.
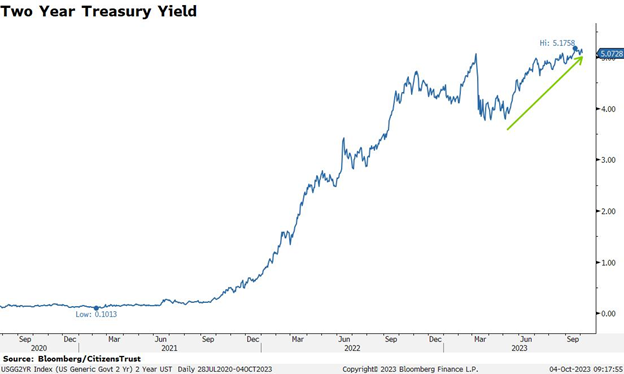
After hiking in July, the Fed chose not to hike at its late-September meeting. They have purposely slowed the pace at which they are tightening monetary policy in recognition that interest rate increases affect the economy with a significant lag. Once again, their forward guidance for further rate hikes showed the potential for one or two more hikes. The two-year U.S. Treasury bond responded accordingly, and the yield reached its highest level in years.
Interest rate yields increased across the treasury curve during the third quarter. The yields on both the 10-year treasury bond and the 30-year treasury bond rose to their highest levels since 2007. This put pressure on bond prices and pushed the Bloomberg Aggregate Index, a broad measure of the bond market, down 3.2% for the third quarter and YTD it is now at a loss of 1.2%.
The Economy
U.S. GDP growth continues to be stronger than expected in 2023. Economic growth is expected to accelerate from the second quarter to third. The better-than-expected growth has been driven by an increase in business investment and a resilient U.S. consumer. Many segments of the economy may not have “felt” great as they were compared to the artificially high post-pandemic growth period, but business conditions have grinded their way back to normal. This solid economic performance has increased the prospects for a so-called “soft landing” for the economy, where economic growth slows below trend but does not tip into a contraction.
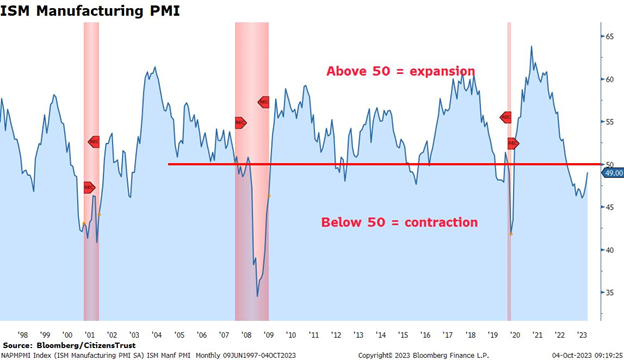
Manufacturing is a leading segment of the U.S. economy and is a representative example of pandemic-related gyrations that are not normal. As the economy reopened and was fed with trillions of dollars in stimulus spending, the ISM Manufacturing index reached the highest levels in decades, which was clearly unsustainable. As year-over-year comparisons to this period unfolded, the index fell sharply and has been below 50, indicating contraction, for several months. Since manufacturing does not dominate the U.S. economy, this can occur for a period without causing a recession. This measure has improved in recent months and could very well move back into expansion territory by the end of the year.
The ISM Services index is even more important to economic growth, and it has remained above 50, in expansion, every month thus far in 2023. In addition, job creation has been steady throughout the year and the labor market remains relatively tight. A sharp economic slowdown simply will not happen until the labor market cracks and unemployment rises. As a result, near-term economic growth will likely be better than the forecasted slowdown that has yet to materialize this year.
The Quarter Ahead
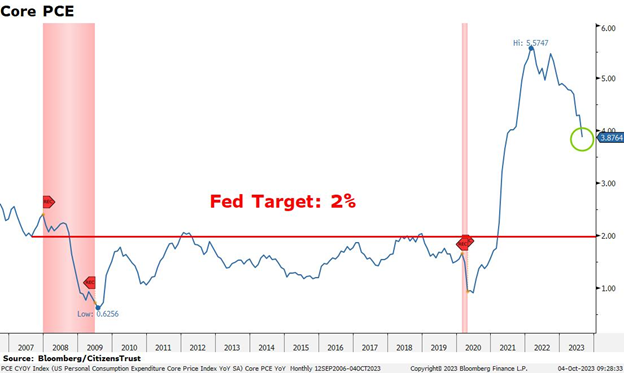
Inflation will continue to be the most important economic measure that investors are focused on since that is what the Fed is targeting. The rate of decline in the noisy Consumer Price Index has slowed but it is well off the generationally high levels of 2022. The Fed’s preferred measure of inflation, Core PCE, has fallen sharply but is still above the Fed’s 2% target. The Fed predicts that this measure will not consistently be at their target until 2025. Thus, the “higher for longer” messaging continues.
While recent economic measures have been better than expected, the lag effect of higher interest rates needs to be respected. Historically, it has taken 12 to 24 months for higher interest rates to start to bite and since we began this cycle from zero, the lag is likely going to be longer than usual. For the intermediate term, the Fed Funds rate is now above the current inflation rate, which signals a restrictive monetary policy. There are two more Fed meetings this year, in November and December. At this point, the market has not priced in another rate hike. The data-dependent Fed will rely on the degree of strength in the fourth quarter to determine its path.
The Fed has spoken at length about the strong labor market and their desire to weaken it. Any signs of weakness in the broad labor market will show up in the weekly Initial Jobless Claims report, then the monthly Non-Farm Payroll survey and ultimately, the unemployment rate. So far, employers have been reluctant to give up employees that they had a hard time finding in recent years. However, if one of those measures begins to deteriorate, it will be a sign that the Fed is done. At that point, investors can debate whether it will be a hard or soft landing for the economy, but until then economic growth continues.
We look forward to serving you and appreciate the trust you have placed in us. Please reach out to your CitizensTrust representative with any questions you may have.
Learn more about CitizensTrust